Cell cycle detection using the SpectraMax MiniMax cell counter
Foreword
The sphere is a small 3D cell culture microenvironment that can be used for cell culture in special methods such as low adsorption microplates. This in vitro 3D cell culture model has high clinical and biological reliability and has been widely used in high-throughput screening (HTS) and advanced cell culture to facilitate the study of major diseases such as compound toxicity and cancer. Multicellular tumor spheroids (MCTS) can mimic tumor tissue, so it is often used to compensate for traditional 2D environments, such as deletions between monolayers and animal models on microplates. At present, 3D technology has been widely accepted as a more accurate method for simulating the biological state of cancer cells in vivo and effectively evaluating new anticancer strategies.
The FUCCI (fluorescent ubiquitination-based cell-cycle indicator) globule can identify which period of the cell cycle the cell is in, so it can be used to study the progression of the cancer cell cycle. The FUCCI technique is based on the identification of two levels of over-expressed protein-regulated proteins, geminin and Cdt1, in which geminin is fused to the green fluorescent group AmCyan and Cdt1 is fused to the red fluorescent group mCherry. The levels of Cdt1 and geminin fluctuate with changes in the cell cycle: Cdt1 protein levels peak in the G1 phase, while geminin levels increase in S, G2 and M phases. This result is reflected in the expression of FUCCI nuclei which are red in the G1 phase and green in the S, G2 and M phases (Fig. 1).

The SpectraMax ® i3x Multi-Purpose Reader features the SpectraMax ® MiniMax TM 300 Cell Counter with transmittedlight(TL), green (Ex/Em:460/541) and red (Ex/Em:625/713) fluorescence channels. The MiniMax Cell Counter's SoftMax ® Pro software can be used to obtain images of various cells and analyze them. This note is intended to show how to quickly and efficiently acquire and analyze images of FUCCI beads using the MiniMax cell counter.
Advantage
- Real-time monitoring of cell cycle progression using cell imaging
- Multi-parameter analysis of cell spheres for easy operation
- SoftMax Pro software provides the flexibility to customize cell sphere analysis methods to meet different experimental requirements
material
- SpectraMax i3x Multi-Purpose Reader (Molecular Devices cat. #i3x)
- SpectraMax MiniMax 300 Cell Imager (Molecular Devices cat. #5024062)
- Corning 96-well low adsorption U backplane (Corning cat. #7007)
- A375S FUCCI cells (Institute of CancerResearch, London)
- DMEM / F12 medium (Invitrogen cat. #11320-033)
- EGF (Invitrogen cat. #PHG0311)
- B27 replenisher (Invitrogen cat #17504001)
method
Sphere production and cultivation
The Institute of Cancer Research (ICR) is responsible for the production of cells expressing the FUCCI reporter systems mCherry-Cdt1 and AmCyan-geminin, and the production is carried out according to the procedure published by Dufau et al. The A375S FUCCI sphere preparation method was as follows: Corning's 96-well U-bottom low-adsorption cell culture plate was added with DMEM/F12 medium containing EGF (20 ng/mL) and B27 (1x), and plated at 1,000 cells per well. After centrifugation (800 g, 6 min) of the cell plates, incubation was carried out at 37 ° C, 5% CO 2 . Finally, the spheres were washed 3 times with medium containing 10% FCS to remove EGF and B27, and the culture was continued for 1 to 6 days.
data analysis
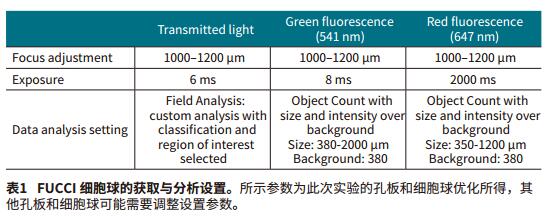
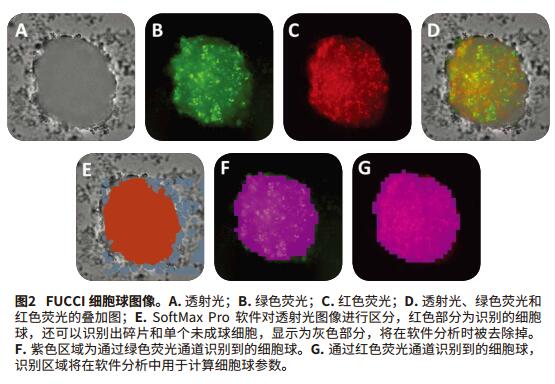
The Transmit Light Module of the MiniMax Cell Counter gives the best image quality from autofocus. "Field Analysis" in SoftMax Pro software allows for custom analysis to identify overlapping parts of cells. We use a special identification method to distinguish between the target sphere and the rest of the object, such as debris and individual cells, which are removed in subsequent analyses (Figure 2, AandE). Finally, we select the area of ​​interest and remove unwanted objects from the image. In the green and red fluorescence channels, the sphere can be easily screened by the difference in size and relative fluorescence intensity in the "Object Count" mode (Figure 2, BD, FG). Then use SoftMax Pro software to calculate the "%Area coverage" of the image and the "Object Area" (μm2) of the sphere. The setting method of image acquisition and analysis is shown in Table 1.
result
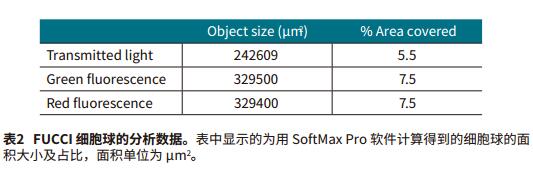
The settings acquired and analyzed in the SoftMax Pro software allow for easy and fast resolution of single spheres in each well under the transmitted light of the green and red fluorescent channels. SoftMax Pro software also calculates the area ratio and object area (μm2) contained in all channels (Figure 2, Table 2). The best results are obtained with green and red fluorescent channels.
For the FUCCI sphere, the red part of Figure 2 shows a smooth rounded sphere and the green part is on the cell surface, indicating that the cells inside the sphere are in the G1 phase and the surface cells are about to enter the M phase.
The corresponding software can distinguish various changes in the size and shape of the sphere (spherical parameters), so it is often used to study the effects of various treatments, such as anticancer drugs, on cell proliferation (Figure 3). The optical shaping function of the green and red fluorescence in MiniMax converts 3D images into 2D projection spheres.
in conclusion
The integrated data analysis of the MiniMax cell counter with SoftMax Pro software can capture and analyze the green and red fluorescent channels and FUCCI spheres under transmitted light. The experimenter can evaluate the sphere in a variety of ways, including the area covered by the image, the size and shape of the object, thus providing the experimenter with a multi-parameter panoramic cellular data analysis. The SpectraMax i3x Multi-Purpose Reader with the MiniMax Cell Counter perfectly combines the advantages of imaging with the simplicity of a plate reader. With a streamlined data acquisition and analysis process, SoftMax Pro software provides a complete solution for FUCCI sphere analysis.

literature
1. Dufau I, Frongia C, Sicard F, Dedieu L, Cordelier P, Ausseil F, Ducommun B, Valette A: Multicellular Tumor Spheroid model to evaluate spatio-temporaldynamics effect of chemotherapeutics.Application to the gemcitabine / CHK1nhibitor combination in pancreaticcancer. Cancer. 2012, 12 (1): 15-10.1186/1471-2407-12-15.
2. Jennifer Laurent, Céline Frongia, Martine Cazales, Odile Mondesert, Bernard Ducommun, Valérie Lobjois: Multicellular tumor spheroid models to explore cell cycle checkpoints in 3D. BMC Cancer. 2013, 13:73, 10.1186/1471-2407-13-73 .
3. http://
4. https://$16360
Walking Frame,Walking Aid Frame,Aluminum Walking Frame,Walking Support Frame
XIAMEN DORRELLA HEALTH TECHNOLOGY CO.,LTD , https://www.dinglimed.com